Katalog
This article delves into the application of analog pressure sensors in digital tire pressure gauges, focusing particularly on how the MEMS-based absolute pressure sensor WF162F achieves high-precision tire pressure measurement. We analyze the operating principle of analog pressure sensors, signal conversion and processing techniques, temperature compensation mechanisms, performance advantages, and methods to ensure measurement accuracy. The study shows that through proper signal conditioning and temperature compensation, the analog pressure sensor can deliver high-precision pressure measurements of ±0.3%FS across a broad temperature range from –40 °C to 125 °C, meeting the stringent requirements of modern automotive tire pressure monitoring. These sensors can withstand five times the maximum pressure shock without damage, and provide stable, reliable analog or digital outputs under 3.3 V/5 V standard supply, offering critical technical support for automotive safety and performance optimization.
Working Principle and Characteristics of MEMS Absolute Pressure Sensors
1.1 Basic Principle of MEMS Pressure Sensors
The core principle of MEMS pressure sensors is based on the micro-mechanical structure’s sensitive response to pressure changes. Absolute pressure sensors such as the WF162F employ a silicon-to-silicon bonding structure, using an N-type substrate with P-type piezoresistors to form a precise Wheatstone full bridge. When pressure is applied to the sensor’s diaphragm, microscopic deformation changes the resistor values, unbalancing the bridge and generating a millivolt-level voltage signal proportional to the pressure. This micromechanical sensing mechanism offers high sensitivity, excellent linearity, and outstanding repeatability, providing a solid foundation for precise tire pressure measurement.
Unlike gauge pressure sensors, absolute pressure sensors measure pressure relative to a vacuum reference, unaffected by ambient atmospheric pressure fluctuations. The sensor contains a sealed vacuum reference cavity, ensuring that measurements always reflect the true absolute pressure—critical for tire pressure monitoring, as tire pressure must correspond to actual physical pressure rather than a variable atmospheric differential.
1.2 Technical Specifications of the WF162F Absolute Pressure Sensor
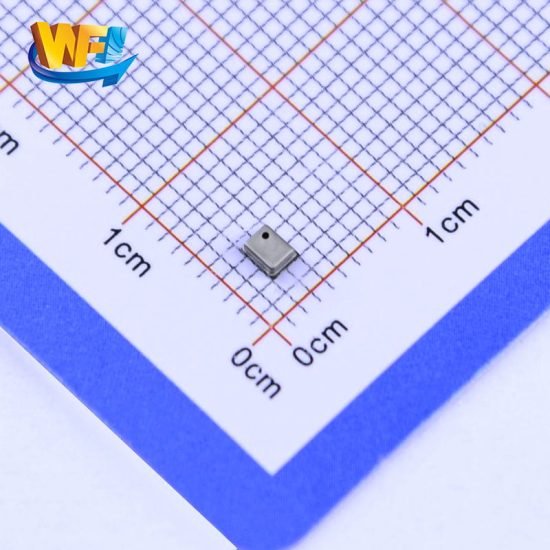
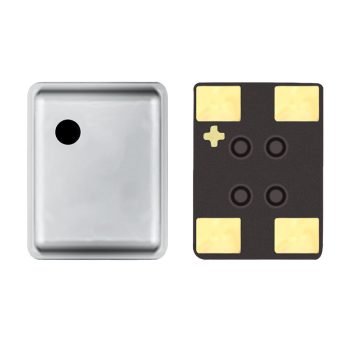
The WF162F absolute pressure sensor is manufactured using advanced MEMS processes and has a broad measurement range of 0–11 bar (0–1100 kPa), fully covering the normal operating pressures of various vehicle tires. At a 5 V supply, it provides a full-scale output of 70–150 mV, with nonlinearity confined within ±0.3%FS, demonstrating excellent measurement precision. Key parameters include:
Measurement Type: Absolute pressure
Pressure Range: 0–1100 kPa (11 bar)
Output Signal: 70–150 mV (full scale)
Zero Offset: –18 to 22 mV
Nonlinearity: ±0.3%FS
Operating Temperature: –40 °C to 125 °C
Overload Capability: 2× rated pressure
Burst Pressure: 4× rated pressure
1.3 Accuracy Requirements for Digital Tire Pressure Gauges
As a safety-critical device, the accuracy of digital tire pressure gauges directly impacts vehicle safety and fuel economy. Industry standards typically require measurement errors within ±1%FS for high-precision gauges, with premium products achieving ±0.5%. For a typical passenger car tire at 220–250 kPa, this means maintaining measurement errors within ±2.5 kPa.
Accuracy classes are categorized into 0.5, 1.0, 1.6, and 2.5 levels, with lower numbers indicating higher precision. Digital gauges usually adopt 0.5 or 1.0 accuracy classes to ensure reliability. They also require robust temperature adaptability to deliver accurate measurements under extreme conditions, essential for long-distance driving and harsh climates.
With high-precision MEMS sensors and advanced signal processing, modern digital gauges can achieve measurement accuracy up to ±0.05%, greatly enhancing reliability and accuracy. This high-precision monitoring enables vehicles to maintain optimal tire pressure, improving handling and extending tire life.
Analog-to-Digital Signal Processing Techniques
2.1 Characteristics of Sensor Output Signals
MEMS pressure sensors like the WF162F output millivolt-level analog signals, typically 70–150 mV at full scale. These weak signals are susceptible to electromagnetic interference and temperature fluctuations, and cannot be used directly for digital display or processing. While analog outputs offer fast response and high resolution, they require signal conditioning and ADC conversion for digital gauges.
Key output characteristics:
Amplitude: Millivolt level (approx. 70–150 mV full scale)
Zero Offset: –18 to 22 mV deviation
Linearity: Within ±0.3%FS
Temperature Sensitivity: Zero and sensitivity drift with temperature
These factors determine the subsequent signal-processing path to achieve accurate digital outputs.
2.2 Signal Conditioning and Amplifier Circuit Design
Signal conditioning transforms the raw sensor output into standardized signals. The typical conditioning process for WF162F includes:
Precision Instrumentation Amplifier: Amplifies the weak millivolt signal to 0–5 V or 0–3.3 V for ADC input, with gains of 20–40× and ensuring low noise, low offset, and high common-mode rejection.
Zero-Offset Calibration Circuit: Uses precision reference voltages and operational amplifiers to nullify the –18 to 22 mV zero offset, often implemented with microcontroller-controlled digital potentiometers for automatic calibration.
Filtering: RC low-pass and multi-stage active filters (cutoff 50–100 Hz) remove high-frequency noise while preserving pressure signal content.
2.3 ADC Conversion and Digital Output Implementation
Digital gauges use 16–24 bit ADCs to capture fine pressure variations. A high-resolution ADC converting 0–5 V signals into 65,536 (16-bit) to 16,777,216 (24-bit) discrete values delivers high measurement fidelity.
Digital processing includes:
Oversampling & Averaging: Reduces random noise by averaging multiple samples
Digital Filtering: FIR or IIR filters further improve signal quality
Nonlinearity Correction: Lookup tables or polynomial fits compensate ±0.3%FS nonlinearity
Temperature Compensation: Algorithms using integrated temperature data
Processed values display on LCD/OLED screens or transmit via SPI, I2C, or UART. Advanced gauges offer data logging and Bluetooth transmission for remote monitoring.
This analog-to-digital chain accurately converts millivolt signals into high-precision digital pressure readings, providing intuitive and reliable information.
Temperature Compensation and Measurement Stability
3.1 Mechanisms of Temperature Effects on Accuracy
Temperature significantly impacts MEMS sensor accuracy through zero drift (–30 to 20 µV/°C) and sensitivity changes (–0.25% to –0.15%FS/°C). Without compensation, measurements can err by over 10% across –40 °C to 125 °C, far exceeding tire monitoring requirements.
Specific effects include:
At low temperatures, increased piezoresistor coefficients raise sensitivity
At high temperatures, zero drift worsens and linearity degrades
Rapid temperature changes cause transient errors due to differential thermal expansion
Tire temperatures can exceed 80 °C under high-speed conditions, making effective compensation essential.
3.2 Hardware Temperature Compensation Methods
Hardware-based compensation strategies include:
Self-Compensation Resistors: Selecting resistor materials with tailored temperature coefficients during fabrication for initial compensation (effective over 0–70 °C).
Thermal-Balanced Bridge Design: Adding resistors in series/parallel to create a bridge with inherent temperature balance over –25 °C to 85 °C.
Integrated Temperature Sensor: On-chip temperature sensing elements provide real-time data for precise compensation.
3.3 Digital Algorithmic Compensation Strategies
Digital approaches maintain high accuracy across commercial (–10 °C to 60 °C), industrial (–25 °C to 85 °C), and military (–40 °C to 125 °C) ranges:
Polynomial Fitting: Calibrating multiple temperature points and fitting 2nd–4th order equations for zero and sensitivity compensation.
Segmented Linear Compensation: Dividing the range into intervals, each with linear correction (simple but requires more data).
Machine Learning Models: Neural networks mapping temperature, raw output, and true pressure for nonlinear and coupling effects; offers high precision but demands extensive training data.
Combining hardware and digital methods achieves ±0.5%FS in commercial, ±1%FS in industrial, and ±1.5%FS in military ranges.
3.4 Dynamic Temperature Compensation Features
For rapidly changing temperatures—during high speeds or emergency braking—advanced gauges sample temperature at 1–10 Hz and apply adaptive filtering to correct transient errors. Multi-point temperature sensing (e.g., tire gas and housing temperatures) captures thermal gradients, refining estimations.
These techniques ensure stable performance even under harsh thermal dynamics.
Performance Advantages and Adaptability
4.1 Analysis of Accuracy and Stability
Analog MEMS sensors like the WF162F deliver ±0.3%FS nonlinearity and, with conditioning and compensation, achieve system accuracy of ±0.5%FS. In an 11 bar range, this equates to a maximum absolute error of 0.055 bar (5.5 kPa), satisfying precise measurement requirements.
Long-term drift is typically <0.1%FS/year, thanks to silicon’s mechanical stability and refined fabrication, ensuring consistent performance over 5–10 years without frequent recalibration.
Response times are in the millisecond range, capturing rapid pressure changes critical for real-time monitoring.
4.2 Durability and Environmental Resilience
The WF162F withstands 2× overload (22 bar) and 4× burst pressure (44 bar) without damage. It operates from –40 °C to 125 °C, with robust sealing against dust, moisture, and vibration. Military-grade versions extend to –55 °C to 150 °C.
Typical lifetime exceeds 1 million pressure cycles, far surpassing tire cycles and reducing maintenance costs.
4.3 Power Requirements and Energy Characteristics
At 5 V, operating current is 1–2 mA (5–10 mW). It accepts 4.5–10 V supplies, compatible with 3.3 V and 5 V systems.
Low power consumption enables handheld gauges with 500–1000 h battery life and TPMS systems lasting several years. Modes include normal, low-power sampling, and deep sleep, optimizing battery usage.
4.4 Cost-Effectiveness and Scalability
Analog sensors cost less than digital outputs of comparable precision. Mature manufacturing and high yields drive down prices in high-volume applications. Standardized interfaces allow multi-vendor compatibility, reducing supply risk.
Reference designs and signal-conditioning modules accelerate development cycles, enabling rapid time-to-market. Analog solutions match or exceed digital performance at a fraction of the cost, making them ideal for mass deployment.
Measurement Tools and Accuracy Verification Methods
5.1 Calibration and Test Equipment
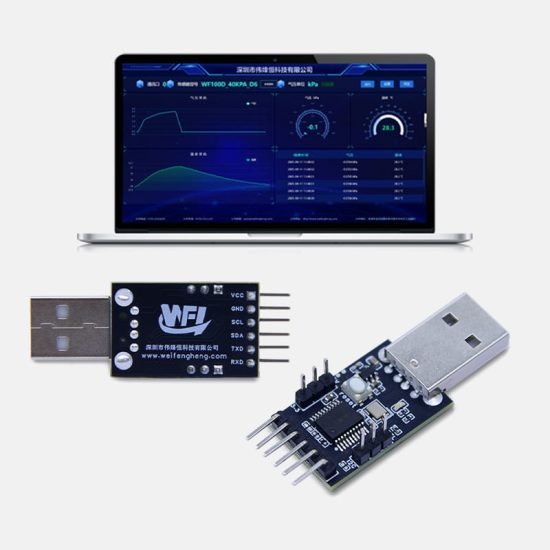
High-precision pressure calibrators (piston gauges or digital controllers) with 0.01%–0.05%FS accuracy provide reference pressures for sensor verification. Programmable temperature chambers (–70 °C to 180 °C, ±0.5 °C stability) test temperature performance. Data acquisition systems with 24-bit ADCs and low-noise amplification capture microvolt-level signals.
5.2 Sensor Parameter Measurement Techniques
Key parameters are measured as follows:
Zero and Full-Scale Outputs: Record outputs at 0 and full-scale pressures to determine sensitivity and offset.
Nonlinearity: Collect data at 5–11 evenly spaced points and compute maximum deviation from ideal linear response.
Temperature Coefficients: Perform temperature sweeps in 10 °C increments, establishing temperature vs. offset and sensitivity curves.
Hysteresis: Compare ascending and descending pressure sequences.
Repeatability: Apply identical conditions multiple times and analyze output consistency.
Durability: Subject sensors to 100k–1M pressure cycles and 1k–10k temperature cycles.
5.3 Ensuring Gauge Accuracy
Accuracy depends on matching sensor range to application, optimizing signal chain design, and employing high-quality components. Factory calibration across pressure and temperature points generates correction parameters stored in each device. User calibration functions allow periodic zero adjustments to counteract drift, maintaining system accuracy at ±0.5%FS.
5.4 On-Site Accuracy Verification
Field tests compare devices against higher-grade reference gauges (0.1 or 0.25 accuracy class) in parallel measurements. Batch consistency tests use multiple units on the same source. Real-world durability trials involve 3–6 months of road testing under varied conditions. Third-party accreditation by metrology institutes provides authoritative validation. Routine recalibration every 6–12 months is recommended for fleet and professional use.
Konklusjon
The integration of analog pressure sensors in digital tire pressure gauges exemplifies the synergy of microelectronics and mechanical engineering. MEMS absolute sensors like the WF162F, with a 0–11 bar range and ±0.3%FS precision, deliver reliable measurements from –40 °C to 125 °C through advanced signal conditioning and temperature compensation.
The mature analog-to-digital processing chain—including amplification, filtering, ADC conversion, and digital post-processing—accurately translates millivolt signals into precise digital readings. Combined hardware and software compensation methods ensure high accuracy across commercial, industrial, and military temperature ranges.
Analog sensors offer superior accuracy, stability, dynamic response, durability, environmental resilience, and energy efficiency. Their cost-effectiveness and scalability make them the preferred choice for large-scale tire pressure monitoring applications.
Comprehensive calibration and verification protocols guarantee system-wide accuracy of ±0.5%FS, providing end-users with trustworthy pressure data. As automotive safety standards rise and consumer awareness grows, high-precision analog sensor–based digital gauges will play an increasingly vital role in aftermarket and OEM applications, underpinning driving safety and fuel economy.
Introduksjonen ovenfor skraper bare overflaten av applikasjonene til trykksensorteknologi. Vi vil fortsette å utforske de ulike typene sensorelementer som brukes i ulike produkter, hvordan de fungerer, og deres fordeler og ulemper. Hvis du vil ha mer detaljer om hva som er diskutert her, kan du sjekke det relaterte innholdet senere i denne veiledningen. Hvis du er presset på tid, kan du også klikke her for å laste ned detaljene i denne veiledningen Lufttrykkssensorprodukt PDF -data.
For mer informasjon om andre sensorteknologier, vennligst Besøk Sensors -siden vår.


