ລາຍການ
Choosing the right differential pressure sensor is critical in product design and manufacturing. This article summarizes how to systematically evaluate and select a sensor from dimensions such as application scenario, measurement accuracy and speed, environmental compatibility, and interface requirements. By combining perspectives of engineers and procurement managers, it offers clear, actionable solutions to meet ±10 kPa range and high sensitivity demands, while ensuring fast response, dust protection, and calibration strategies for stable and reliable mass production.
Application Scenarios and Requirement Assessment
1.1 Measured Media and Pressure Range
Before selection, define the measured medium (air, nitrogen, or mixed gases) and the expected pressure range. For gas flow monitoring, ±10 kPa is common, but if only detecting 500 Pa, choose a high-sensitivity, low-range model. Proper range matching prevents accuracy loss and overload risk.
1.2 Installation Environment and Protection
Sensors may face dust, moisture, or chemical exposure. The WF200DP series features a dust-proof grille design and optional IP65 enclosure to resist particulate contamination and light water splashes.
1.3 System Interface and Supply Voltage
Confirm communication with the controller or data acquisition system: analog 0–5 V, 0-2 mA, or digital SPI/I²C outputs. Matching the supply voltage (e.g., 3.3 V or 5 V) and signal compatibility simplifies hardware design and debugging.
1.4 Batch Selection and Production Planning
Before full-scale production, validate prototypes. Use a high-precision calibration bench (with temperature control) to test multiple samples for consistency, verifying drift, hysteresis, and repeatability meet specifications. Then establish production inspection procedures to ensure stable quality.
Measurement Accuracy and Speed Considerations
2.1 Resolution and Sensitivity
Resolution determines the ability to detect minute pressure changes. The WF200DP series achieves 0.01 Pa resolution within ±10 kPa, ensuring detection of subtle flow or micro-pressure differences.
2.2 Response Time and Dynamic Performance
Response time affects tracking of rapid pressure changes. For applications needing instant flow fluctuation capture, choose models with <1 ms response time to prevent data lag and control system misjudgment.
2.3 Temperature Drift and Compensation
Temperature shifts cause zero-point and full-scale drift. High-quality sensors include temperature compensation circuits, maintaining ≤0.1% F.S. drift from –20 ℃ to +85 ℃, reducing errors from environmental temperature variations.
2.4 Consistency and Calibration Coefficients
For air and nitrogen, calibrate sensors with separate coefficients to ensure high-precision conversion (pressure → mass flow or volume flow) under different gas viscosities and densities.
")
Interface Compatibility and Signal Conditioning
3.1 Output Type Selection
Choose the sensor’s output based on your data acquisition system: analog voltage (0–5 V) or current (0-2.0 mA) for PLC/DCS integration, or digital SPI/I²C for microcontroller and FPGA applications requiring high-speed, synchronized sampling.

3.2 Signal Conditioning and Filtering
Sensor outputs are often affected by power noise, environmental interference, and vibration. Implement a low-pass filter to suppress high-frequency noise and use an operational amplifier stage for additional signal gain on analog channels. For digital outputs, apply firmware-level filters such as moving average or Kalman filters to smooth fluctuations.
3.3 Power Supply Stability
Differential sensors are sensitive to supply variations; even a ±0.1 V change can induce drift. Prefer sensors with built-in regulators or add a high-precision LDO module in your design, plus decoupling capacitors and EMI filters to minimize ripple.
Installation, Soldering, and Usage Guidelines
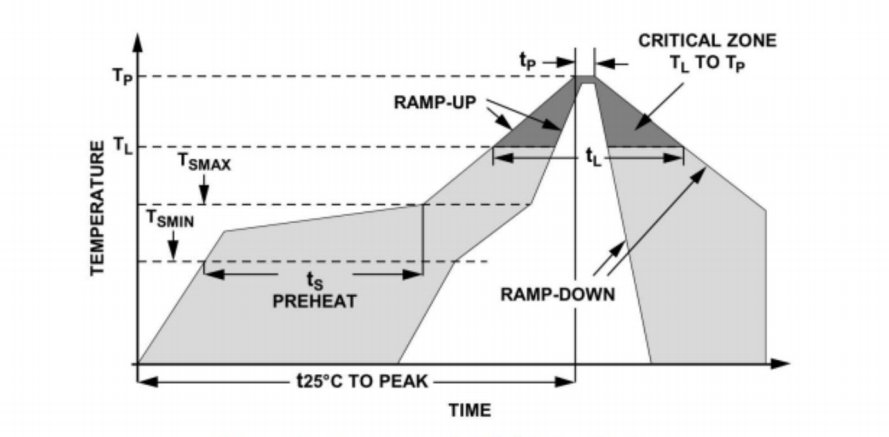
4.1 Soldering Process
Limit soldering temperature to 260 ℃ for no more than 5 seconds, using lead-free reflow or hot-air soldering. Excess heat can induce package stress and seal degradation. Clean flux residues within 3 minutes after soldering to prevent chemical corrosion.
4.2 Dust Protection and Sealing
The WF200DP series includes a dust-proof grille; for dusty or humid environments, add a protective cover with a breather or employ nitrogen purging to keep ports free of particulates.
4.3 Calibration and Verification
After installation, perform a static two-point calibration at 0 Pa and full-scale (±10 kPa), record zero and span errors, then verify at midpoints (+5 kPa/–5 kPa) to ensure errors remain within ±0.1% F.S.
Pre-Production Testing and Validation
5.1 Prototype Testing Plan
Before mass production, use a temperature-controlled precision pressure calibrator to test 10% of units through temperature cycles (–20 ℃ to +60 ℃) and pressure cycles (–10 kPa to +10 kPa), logging zero drift, span drift, and response time against specs.
5.2 Recommended Testing Equipment
Employ a high-precision pressure source (e.g., BP-5000 series), a digital multimeter with 0.1 mV resolution or a ≥10 kHz data acquisition card, and an environmental chamber for synchronized pressure and temperature measurements.
")
5.3 Quality Control Focus
Set up inline test stations for zero, span, temperature drift, and response speed. Remove out-of-spec units and perform batch statistical analysis to ensure consistency across production.
ສະຫຼຸບ
This guide has walked you through five essential chapters—application assessment, accuracy and speed considerations, interface and signal conditioning, installation and soldering best practices, and pre-production testing—to ensure you select the optimal differential pressure sensor for your product. By aligning ±10 kPa range, 0.01 Pa sensitivity, dust-proof design, temperature compensation, and system compatibility, you’ll achieve stable, reliable performance in air, nitrogen, and various gas flow applications.
ການແນະນໍາຂ້າງເທິງພຽງແຕ່ scratches ດ້ານຂອງຄໍາຮ້ອງສະຫມັກຂອງເຕັກໂນໂລຊີເຊັນເຊີຄວາມກົດດັນ. ພວກເຮົາຈະສືບຕໍ່ຄົ້ນຫາປະເພດຕ່າງໆຂອງອົງປະກອບເຊັນເຊີທີ່ໃຊ້ໃນຜະລິດຕະພັນຕ່າງໆ, ວິທີການເຮັດວຽກ, ແລະຂໍ້ດີແລະຂໍ້ເສຍຂອງມັນ. ຖ້າທ່ານຕ້ອງການລາຍລະອຽດເພີ່ມເຕີມກ່ຽວກັບສິ່ງທີ່ໄດ້ສົນທະນາຢູ່ທີ່ນີ້, ທ່ານສາມາດກວດເບິ່ງເນື້ອຫາທີ່ກ່ຽວຂ້ອງໃນພາຍຫຼັງໃນຄູ່ມືນີ້. ຖ້າຫາກວ່າທ່ານກໍາລັງກົດດັນສໍາລັບການໃຊ້ເວລາ, ທ່ານຍັງສາມາດຄລິກທີ່ນີ້ເພື່ອດາວໂຫລດລາຍລະອຽດຂອງຄູ່ມືນີ້ ຂໍ້ມູນ PDF ຜະລິດຕະພັນ PDOR Air.
ສໍາລັບຂໍ້ມູນເພີ່ມເຕີມກ່ຽວກັບເຕັກໂນໂລຊີເຊັນເຊີອື່ນໆ, ກະລຸນາ ເຂົ້າເບິ່ງຫນ້າສັນຍາລັກຂອງພວກເຮົາ.
-e1747998312687.jpg)

