목록
압력 센서의 선형성을 판단하는 것은 센서의 측정 정확도에 직접적인 영향을 미치기 때문에 매우 중요하고 일반적인 작업입니다.
1. 선형성이란 무엇입니까?
비선형 오류라고도 하는 선형성은 압력 센서의 실제 출력 특성 곡선(출력 신호와 입력 압력 간의 관계)과 이상적인 직선(맞춤된 선) 간의 최대 편차를 나타냅니다. 이 편차는 일반적으로 전체 규모 출력(FSO, 전체 규모 출력)의 백분율로 표시됩니다.
간단히 말해서, 이상적인 압력 센서의 출력은 입력 압력에 완벽하게 비례하여 직선을 형성해야 합니다. 그러나 실제로는 제조 공정, 재료 특성 및 기타 요인으로 인해 모든 센서의 실제 곡선이 약간의 변동을 보입니다. 선형성은 실제 곡선이 얼마나 "직선"인지를 측정하는 척도입니다.
")
2. 선형성을 계산하는 주요 단계
1). 교정 데이터 획득
이것이 선형성을 판단하는 기초이다. 알려진 균일하게 분포된 일련의 압력 지점(일반적으로 영점과 전체 범위 지점, 최소 3~5개의 중간 지점 포함)에서 센서의 출력을 기록해야 합니다. 이러한 데이터는 센서 제조업체에서 제품 데이터시트에 제공하는 경우가 많으며, 고정밀 교정 장비를 사용하여 직접 수집할 수도 있습니다.
2). "적합선" 결정
선형성을 계산하려면 "적합선"이라는 참조가 필요합니다. 이 선을 그리는 방법은 다양하며 선택한 방법은 선형성 수치에 직접적인 영향을 미칩니다. 선형성을 해석할 때 첫 번째 작업은 데이터시트나 보고서가 어떤 피팅 방법을 사용했는지 확인하는 것입니다.
일반적인 방법은 다음과 같습니다.
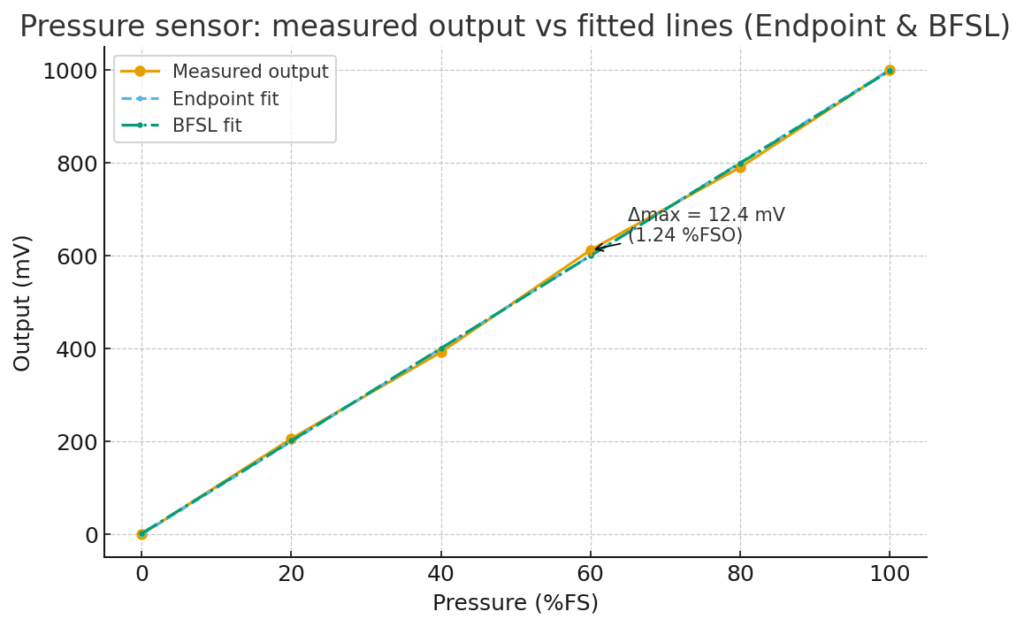
끝점선: 영점(0% 압력)과 풀 스케일 지점(100% 압력) 사이에 직선을 그립니다. 이것이 가장 일반적이고 간단한 방법입니다.
BFSL(Best Fit Straight Line) 또는 최소 제곱법: 수학을 사용하여 선과 모든 실제 데이터 포인트 사이의 제곱 편차의 합을 최소화하는 선을 찾습니다. 이는 일반적으로 종점 방법보다 선형성 오류가 더 작습니다.
0 기반 방법: 적합선이 0을 통과하도록 강제한 다음 기울기를 조정하여 최대 편차를 최소화합니다.
중요 사항: 다양한 피팅 방법을 사용하여 얻은 선형성 수치는 직접 비교할 수 없습니다! 예를 들어, 엔드포인트 방법에 의해 ±1.0%FS 선형성으로 지정된 센서는 최적합 방법에 의해 ±0.5%FS로 지정된 센서와 유사하게 작동할 수 있습니다. 따라서 참조방법을 명확히 해야 합니다.
3). 최대 편차를 계산하고 "맞춤선"을 결정합니다.
선택한 적합선을 기반으로 각 교정 지점에서 실제 출력과 적합선의 이론값 간의 차이를 계산합니다.
편차 = 실제 출력 - 적합선 값
모든 점 중에서 가장 큰 절대 편차, 즉 최대 편차(Δmax)를 찾습니다.
4). 선형성 오류 계산
최대 편차를 센서의 전체 범위 출력(FSO)으로 나누고 백분율로 표시합니다.
선형성 오류(%) = (|Δmax| / FSO) × 100%
여기서 FSO = V_max − V_min.
3. 데이터시트의 선형성 수치를 어떻게 해석합니까?
값을 확인하세요: 그림이 작을수록 선형성이 좋아지고 센서 정확도가 높아집니다. 예를 들어 ±0.1%FS는 ±1.0%FS보다 훨씬 좋습니다.
단위를 확인하십시오: %FS(전체 규모의 백분율)인지 확인하세요. 그것이 표준 단위입니다. 때로는 낮은 쪽에서 더 엄격한 %Reading(읽기 비율)을 볼 수도 있습니다. 두 가지를 주의해서 구별하세요.
조건을 확인하세요. 선형성이 지정된 온도 및 기타 조건(일반적으로 실온, 25°C)을 기록해 두십시오. 온도 변화는 선형성에 큰 영향을 미칠 수 있습니다.
방법을 확인하세요(가장 중요!): 선형성을 계산하는 데 어떤 적합선 방법이 사용되었는지 항상 확인하십시오.
선형성 및 경사 성능이 우수합니다.
결론
선형성은 압력 센서의 출력이 이상적인 직선을 얼마나 가깝게 따르는지 측정하고 전체 범위 출력(FSO)에 대한 최대 편차로 표현됩니다. 이를 평가하려면 교정점을 수집하고 적합선 방법(종점, BFSL 또는 0 기반)을 선택하고 최대 편차 Δmax를 계산한 다음 이를 FSO의 백분율로 변환합니다. 센서를 비교하기 전에 항상 데이터시트의 단위, 온도 조건 및 피팅 방법을 확인하십시오.
위의 소개는 압력 센서 기술 적용의 표면적인 부분에 불과합니다. 우리는 다양한 제품에 사용되는 다양한 유형의 센서 요소, 작동 방식, 장점과 단점을 계속해서 탐구할 것입니다. 여기에서 논의된 내용에 대해 더 자세히 알아보려면 이 가이드 뒷부분의 관련 콘텐츠를 확인하세요. 시간이 촉박한 경우 여기를 클릭하여 이 가이드의 세부정보를 다운로드할 수도 있습니다. 공기 압력 센서 제품 PDF 데이터.
다른 센서 기술에 대한 자세한 내용은 다음을 참조하십시오. 센서 페이지를 방문하십시오.
-e1747998312687.jpg)