- Oleh Sensor WF
Dari sudut penggunaan sensor tekanan diferensial untuk memantau apakah filter detektor asap masuk diblokir, bagian ini membahas pendekatan tekanan diferensial berbasis MEMS: cara kerjanya, cara memilih dan menempatkan sensor, logika pengambilan sinyal, serta pemeliharaan dan validasi lapangan. Filter yang tersumbat mengurangi aliran sampel dan menyebabkan kesalahan pengukuran. Mengukur tekanan di kedua sisi filter dengan sensor dan mengubahnya menjadi sinyal listrik memungkinkan Anda mengatur peringatan dini dan petunjuk pemeliharaan, menjaga sistem pengambilan sampel dan deteksi tetap berjalan dengan andal.
Katalog
1. Prinsip dan metode pengukuran
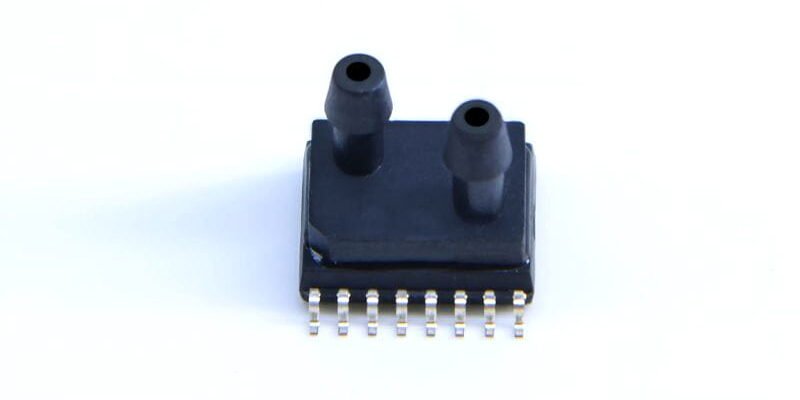
Ide inti penggunaan sensor tekanan diferensial untuk mendeteksi filter yang tersumbat sangatlah mudah: bandingkan tekanan di kedua sisi filter. Dalam sistem pengambilan sampel masuk, filter menangkap partikulat seiring waktu, menambah hambatan dan menyebabkan perbedaan tekanan antara saluran masuk dan saluran keluar. Hubungkan sensor tekanan diferensial MEMS di kedua sisi filter untuk mengukur ΔP. Sensor mengubah perbedaan tekanan fisik menjadi keluaran listrik standar (tegangan atau arus) dan meneruskannya ke pengontrol atau sistem pemantauan untuk pemeriksaan logika. Pemilihan sensor harus memberikan sensitivitas yang cukup dan stabilitas nol sehingga Anda dapat melihat peningkatan resistensi sejak dini dan memicu pemeliharaan atau menyesuaikan pengambilan sampel sebelum kinerja menurun. Gambar yang diberikan menunjukkan paket port ganda umum yang berguna untuk sambungan selang langsung, sehingga memudahkan penggantian kabel dan penggantian di lokasi.
Prinsip sensor dan jalur pengukuran tekanan diferensial
Sensor ini memiliki dua input tekanan untuk merasakan sisi hulu dan hilir filter. Secara internal, elemen mesin mikro – seringkali piezoresistif atau kapasitif – mengubah perbedaan tersebut menjadi sinyal listrik. Sinyal tersebut kemudian melewati amplifikasi dan kompensasi suhu sebelum dikeluarkan. Pengontrol menghitung ΔP sesaat dan membandingkannya dengan ambang batas yang telah ditentukan. Penempatan tempat pengambilan sampel yang baik dan pipa yang rapi meminimalkan kesalahan pengukuran dan menjadikan pendeteksian lebih andal. Memilih sensor dengan output digital membantu mengurangi interferensi saluran analog dan membuat diagnostik jarak jauh dan logging jauh lebih sederhana.
")
2. Pertimbangan desain dan saran pemilihan
Saat memilih sensor, prioritaskan jangkauan, sensitivitas, dan stabilitas jangka panjang. Untuk skenario bangunan dan pengambilan sampel cerobong, Anda biasanya memerlukan rentang dari beberapa puluh Pascal hingga beberapa kilopascal, jadi pilihlah sensor tekanan diferensial MEMS dengan penyimpangan nol rendah dan karakteristik suhu stabil. Untuk integrasi sistem, dukungan output industri standar (4–20 mA, 0–10 V, atau bus digital) membuat hidup lebih mudah. Model paket dan perlengkapan pengambilan sampel juga penting: wadah ramah lapangan dengan lubang selang atau sambungan cepat mempercepat pemeliharaan dan pertukaran. Dari sudut pandang teknik, perangkat dengan instruksi kalibrasi yang jelas dan interval kalibrasi yang disarankan akan mengurangi biaya pemeliharaan di kemudian hari.
Jangkauan sensor, akurasi dan pencocokan antarmuka
Pilih rentang pengukuran berdasarkan penurunan tekanan awal filter dan perkiraan puncak saat tersumbat — berikan margin untuk keamanan. Akurasi harus menyeimbangkan resolusi dan pengulangan; resolusi pada pita tekanan rendah menentukan apakah Anda akan menemukan penyumbatan pada tahap awal. Untuk antarmuka, sensor dengan kompensasi suhu dan linearisasi, atau sensor dengan output digital, memungkinkan Anda menerapkan koreksi sisi perangkat lunak dan logika alarm. Hal ini meningkatkan keandalan sistem secara keseluruhan dan membuat integrasi ke dalam sistem manajemen gedung menjadi lebih lancar.
3. Integrasi sistem dan tata letak pipa
Solusi pemantauan yang sukses sangat bergantung pada tabung dan pengaturan pengambilan sampel serta pada sensor itu sendiri. Pipa yang panjang atau berkelok-kelok, atau alat kelengkapan yang bocor, akan menumpulkan akurasi dan memperlambat respons. Tempatkan tempat pengambilan sampel sedekat mungkin dengan media filter, gunakan tabung yang pendek dan cukup kaku, dan hindari cabang yang tidak diperlukan. Pengambilan data real-time dan pencatatan tren sangat penting — tren menunjukkan penyumbatan bertahap jauh sebelum satu ambang batas tercapai. Pengontrol harus mendukung pengujian mandiri sehingga dapat menandai kesalahan saluran dan beralih ke mode diagnostik atau membunyikan alarm ketika ada yang tidak beres.
Penempatan tempat pengambilan sampel dan analisis dampak panjang pipa
Posisi port membuat perbedaan besar: port di dekat permukaan filter mencerminkan perubahan resistansi yang sebenarnya. Port yang terlalu jauh akan diperhalus dengan volume pipa dan ruang mati sistem. Selang yang panjang menambah kelambatan dan penurunan tekanan ekstra, jadi usahakan pipa tetap pendek dan gunakan bahan inert untuk menghindari adsorpsi atau retensi. Saat memasang, pastikan pipa tidak tertekuk atau tergencet — hal ini merupakan sumber umum terjadinya pembacaan buruk dalam jangka panjang.
4. Pemrosesan sinyal, ambang batas dan strategi alarm
ΔP mentah memerlukan penyaringan, penghilangan kebisingan, dan kompensasi penyimpangan sebelum menjadi sinyal keputusan yang dapat diandalkan. Pulsasi jangka pendek harus dihilangkan dengan jendela atau filter yang sesuai, dan penyimpangan jangka panjang ditangani dengan pemeriksaan nol secara berkala atau mengacu pada tekanan sekitar. Rencana alarm Anda harus menyeimbangkan sensitivitas dan penekanan alarm palsu: terapkan ambang batas berjenjang (saran, tindakan diperlukan, kritis) dan gabungkan ΔP dengan metrik lain — misalnya beban pompa atau aliran terukur — untuk mengurangi peringatan palsu. Dalam pengaturan sensor gedung berjaringan, pembaruan parameter jarak jauh dan pengunggahan log adalah fitur berharga untuk pemantauan terpusat dan penjadwalan pemeliharaan yang efisien.
Metode kalibrasi, pemfilteran, dan penekanan alarm palsu
Kalibrasi harus mencakup titik-titik pengoperasian umum dan mencakup pemeriksaan batas, sambil mendokumentasikan garis dasar dan kurva respons suhu untuk kompensasi online. Gunakan filter low-pass atau adaptif untuk menghilangkan lonjakan sementara dan terapkan pemeriksaan statistik untuk mengidentifikasi kenaikan yang sebenarnya didorong oleh tren. Untuk mengurangi alarm palsu, dasarkan pemicu pada beberapa indikator, bukan pada angka ΔP saja — pasangkan dengan penarikan arus pompa atau pengurangan aliran, misalnya. Logika multi-faktor semacam itu secara dramatis mengurangi peringatan gangguan dan menjaga fokus pemeliharaan pada tempat yang benar-benar diperlukan.
5. Praktek pemeliharaan, validasi dan penerapan
Saat penerapan, tetapkan rutinitas penerimaan dan pemeliharaan yang jelas: pemeriksaan komisioning awal, pengujian fungsi berkala, dan kalibrasi di lokasi. Perawatan harus mencakup pemeriksaan selang, pembersihan port pengambilan sampel, dan pemeriksaan sensor nol. Untuk instalasi gedung, masukkan perangkat ke dalam jadwal inspeksi fasilitas rutin dan catat setiap kalibrasi sehingga Anda dapat melihat tren jangka panjang dan merencanakan perubahan filter sebelum kinerja memburuk. Memilih sensor modular yang dapat Anda tukar tanpa harus mati dalam waktu lama akan mempersingkat waktu henti dan menurunkan biaya siklus hidup.
Prosedur inspeksi dan pemantauan operasional dalam sistem gedung
Mulailah dengan peninjauan data: tarik riwayat tren ΔP, lalu periksa secara visual selang, lubang sampel, pompa, dan alat kelengkapan untuk mengetahui adanya kebocoran atau penyumbatan. Setelah bagian mekanis diperiksa, lakukan pemeriksaan nol dan rentang serta catat hasilnya. Pemantauan operasional harus mendukung peringatan jarak jauh dan laporan otomatis yang menandai tingkat risiko sehingga tim pemeliharaan dapat memprioritaskan kunjungan. Hal ini menjaga waktu aktif tetap tinggi dan memungkinkan layanan prediktif berdasarkan data, bukan perbaikan reaktif.
Kesimpulan
Memasang sensor tekanan diferensial MEMS di seluruh filter detektor asap masuk, dan memasangkannya dengan tata letak pipa suara, pemrosesan sinyal yang solid, dan logika alarm berjenjang, memberi Anda cara awal dan andal untuk mengenali filter yang diblokir. Pemilihan perangkat yang tepat serta kalibrasi dan pemeliharaan rutin yang jelas adalah fondasi kinerja jangka panjang yang stabil. Menghubungkan sensor ke dalam platform manajemen gedung memungkinkan pengawasan terpusat dan perencanaan pemeliharaan berbasis data, mengurangi risiko operasional dan meningkatkan ketersediaan.
Pengenalan di atas hanya sekilas tentang penerapan teknologi sensor tekanan. Kami akan terus mengeksplorasi berbagai jenis elemen sensor yang digunakan di berbagai produk, cara kerjanya, serta kelebihan dan kekurangannya. Jika Anda ingin mengetahui detail selengkapnya tentang apa yang dibahas di sini, Anda dapat melihat konten terkait nanti di panduan ini. Jika Anda terdesak waktu, Anda juga dapat mengklik di sini untuk mengunduh rincian panduan ini Data PDF Produk Sensor Tekanan Udara.
Untuk informasi lebih lanjut tentang teknologi sensor lainnya, silakan Kunjungi Halaman Sensor Kami.