Catalogue
Juger de la linéarité d'un capteur de pression est une tâche très importante et courante, car elle affecte directement la précision de mesure du capteur.
1. Qu'est-ce que la linéarité ?
La linéarité, également appelée erreur de non-linéarité, fait référence à l'écart maximal entre la courbe caractéristique de sortie réelle d'un capteur de pression (la relation entre le signal de sortie et la pression d'entrée) et une ligne droite idéale (la ligne ajustée). Cet écart est généralement exprimé en pourcentage de la sortie à pleine échelle (FSO, Full Scale Output).
En termes simples, la sortie d’un capteur de pression idéal doit être parfaitement proportionnelle à la pression d’entrée, formant une ligne droite. En réalité, cependant, en raison des processus de fabrication, des propriétés des matériaux et d’autres facteurs, la courbe réelle de chaque capteur présente de légères fluctuations. La linéarité est la mesure qui mesure à quel point cette courbe réelle est « droite ».
")
2. Étapes clés pour calculer la linéarité
1). Obtenir les données d'étalonnage
C’est la base pour juger de la linéarité. Vous devez enregistrer la sortie du capteur à une série de points de pression connus et uniformément répartis (incluant généralement le point zéro et le point de pleine échelle, plus au moins 3 à 5 points intermédiaires). Ces données sont souvent fournies par le fabricant du capteur (dans la fiche technique du produit), ou vous pouvez les collecter vous-même à l'aide d'un équipement d'étalonnage de haute précision.
2). Déterminer la « ligne ajustée »
Le calcul de la linéarité nécessite une référence : la « ligne ajustée ». La manière dont cette ligne est tracée varie et la méthode choisie affecte directement le chiffre de linéarité. Lors de l'interprétation de la linéarité, la première tâche consiste à confirmer la méthode d'ajustement utilisée par la fiche technique ou le rapport.
Les méthodes courantes incluent :
Ligne de point final: Tracez une ligne droite entre le point zéro (pression 0%) et le point pleine échelle (pression 100%). C'est la méthode la plus courante et la plus simple.
Méthode de la ligne droite la mieux ajustée (BFSL) ou des moindres carrés: Utilisez les mathématiques pour trouver la ligne qui minimise la somme des écarts carrés entre la ligne et tous les points de données réels. Cela donne généralement une erreur de linéarité plus petite que la méthode du point final.
Méthode base zéro: forcez la ligne ajustée à passer par zéro, puis ajustez sa pente pour minimiser l'écart maximum.
Remarque importante : Les valeurs de linéarité obtenues à l'aide de différentes méthodes d'ajustement ne sont pas directement comparables ! Par exemple, un capteur spécifié avec une linéarité de ± 1,0 % FS par la méthode du point final pourrait fonctionner de manière similaire à un capteur spécifié comme ± 0,5 % FS par la méthode du meilleur ajustement. Par conséquent, vous devez être clair sur la méthode de référence.
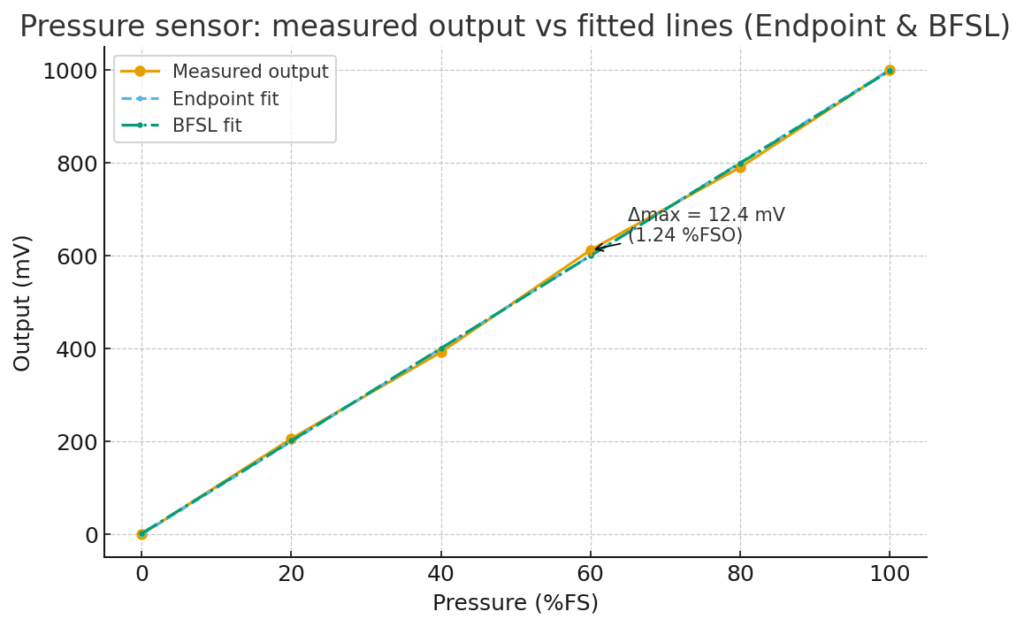
3). Calculer l'écart maximum Déterminer la « ligne d'ajustement »
Sur la base de la ligne ajustée choisie, calculez à chaque point d'étalonnage la différence entre la sortie réelle et la valeur théorique sur la ligne ajustée :
Écart = Sortie réelle − Valeur de la ligne d'ajustement
Trouvez le plus grand écart absolu parmi tous les points – c’est-à-dire l’écart maximum (Δmax).
4). Calculer l'erreur de linéarité
Divisez l’écart maximal par la sortie pleine échelle (FSO) du capteur et exprimez-le en pourcentage :
Erreur de linéarité (%) = (|Δmax| / FSO) × 100 %
Où FSO = V_max − V_min.
3. Comment interpréter les chiffres de linéarité dans une fiche technique ?
Vérifiez la valeur : Plus le chiffre est petit, meilleure est la linéarité et plus la précision du capteur est élevée. Par exemple, ±0,1 %FS est bien meilleur que ±1,0 %FS.
Vérifiez l'unité : Assurez-vous qu'il s'agit de %FS (pourcentage de pleine échelle). C'est l'unité standard. Parfois, vous pouvez voir %Reading (pourcentage de lecture), qui est plus strict dans le bas de l'échelle — veillez à bien distinguer les deux.
Vérifiez les conditions : Notez la température et les autres conditions dans lesquelles la linéarité a été spécifiée (généralement température ambiante, 25°C). Les changements de température peuvent affecter considérablement la linéarité.
Vérifiez la méthode (la plus importante !) : Vérifiez toujours quelle méthode de ligne ajustée a été utilisée pour calculer la linéarité.
Les performances de linéarité et de pente sont excellentes
Conclusion
La linéarité mesure dans quelle mesure la sortie d'un capteur de pression suit une ligne droite idéale et est exprimée comme l'écart maximal par rapport à la sortie à pleine échelle (FSO). Pour l'évaluer, vous collectez des points d'étalonnage, choisissez une méthode de ligne ajustée (point final, BFSL ou base zéro), calculez l'écart maximal Δmax et convertissez-le en pourcentage de FSO. Vérifiez toujours l’unité de la fiche technique, les conditions de température et la méthode de montage avant de comparer les capteurs.
L’introduction ci-dessus ne fait qu’effleurer la surface des applications de la technologie des capteurs de pression. Nous continuerons à explorer les différents types d’éléments capteurs utilisés dans divers produits, leur fonctionnement ainsi que leurs avantages et inconvénients. Si tu’D Like plus de détails sur ce’Comme discuté ici, vous pouvez consulter le contenu associé plus loin dans ce guide. Si vous êtes pressé par le temps, vous pouvez également cliquer ici pour télécharger les détails de ce guide Données PDF du produit du capteur de pression d'air.
Pour plus d'informations sur d'autres technologies de capteurs, veuillez Visitez notre page de capteurs.