Catalogar
Este artículo profundiza en la aplicación de sensores de presión analógicos en manómetros digitales de neumáticos, centrándose particularmente en cómo el sensor de presión absoluta basado en MEMS WF162F logra una medición de presión de neumáticos de alta precisión. Analizamos el principio de funcionamiento de sensores de presión analógicos, técnicas de procesamiento y conversión de señales, mecanismos de compensación de temperatura, ventajas de rendimiento y métodos para garantizar la precisión de las mediciones. El estudio muestra que mediante un acondicionamiento de señal y una compensación de temperatura adecuados, el sensor de presión analógico puede ofrecer mediciones de presión de alta precisión de ±0,3% FS en un amplio rango de temperatura de –40 °C a 125 °C, cumpliendo con los estrictos requisitos del control moderno de la presión de los neumáticos de los automóviles. Estos sensores pueden soportar cinco veces el choque de presión máximo sin sufrir daños y proporcionar salidas analógicas o digitales estables y confiables con un suministro estándar de 3,3 V/5 V, lo que ofrece soporte técnico crítico para la seguridad automotriz y la optimización del rendimiento.
Principio de trabajo y características de los sensores de presión absolutos de MEMS
1.1 Principio básico de los sensores de presión MEMS
El principio básico de los sensores de presión MEMS se basa en la respuesta sensible de la estructura micromecánica a los cambios de presión. Los sensores de presión absoluta, como el WF162F, emplean una estructura de unión de silicio a silicio, utilizando un sustrato tipo N con piezorresistencias tipo P para formar un puente completo de Wheatstone preciso. Cuando se aplica presión al diafragma del sensor, la deformación microscópica cambia los valores de la resistencia, desequilibrando el puente y generando una señal de voltaje de nivel de milivoltios proporcional a la presión. Este mecanismo de detección micromecánico ofrece alta sensibilidad, excelente linealidad y excelente repetibilidad, lo que proporciona una base sólida para una medición precisa de la presión de los neumáticos.
A diferencia de los sensores de presión manométrica, los sensores de presión absoluta miden la presión relativa a una referencia de vacío, sin verse afectados por las fluctuaciones de la presión atmosférica ambiental. El sensor contiene una cavidad de referencia de vacío sellada, lo que garantiza que las mediciones siempre reflejen la presión absoluta verdadera, algo fundamental para el control de la presión de los neumáticos, ya que la presión de los neumáticos debe corresponder a la presión física real en lugar de a un diferencial atmosférico variable.
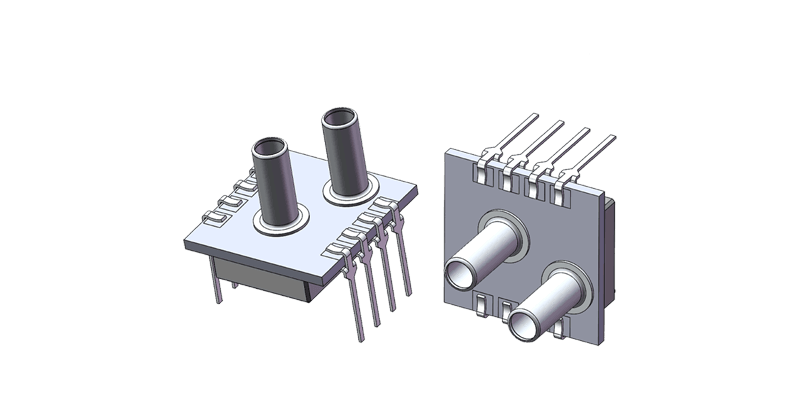
1.2 Especificaciones técnicas del sensor de presión absoluta WF162F
El sensor de presión absoluta WF162F se fabrica mediante procesos MEMS avanzados y tiene un amplio rango de medición de 0 a 11 bar (0 a 1100 kPa), que cubre completamente las presiones de funcionamiento normales de varios neumáticos de vehículos. Con un suministro de 5 V, proporciona una salida de escala completa de 70 a 150 mV, con una no linealidad limitada a ±0,3 % FS, lo que demuestra una excelente precisión de medición. Los parámetros clave incluyen:
Tipo de medida: presión absoluta
Rango de presión: 0–1100kPa (11bar)
Señal de salida: 70–150 mV (escala completa)
Compensación cero: –18 a 22mv
No linealidad: ± 0.3%FS
Temperatura de funcionamiento: –40 ° C a 125 ° C
Capacidad de sobrecarga: 2× presión nominal
Presión de estallido: 4× presión nominal

1.3 Requisitos de precisión para los manómetros digitales de neumáticos
Como dispositivo crítico para la seguridad, la precisión de los manómetros digitales de neumáticos afecta directamente la seguridad del vehículo y la economía de combustible. Los estándares de la industria generalmente requieren errores de medición dentro de ±1% FS para medidores de alta precisión, y los productos premium alcanzan ±0,5%. Para un neumático típico de turismo a 220-250 kPa, esto significa mantener los errores de medición dentro de ±2,5 kPa.
Las clases de precisión se clasifican en niveles 0,5, 1,0, 1,6 y 2,5; los números más bajos indican una mayor precisión. Los medidores digitales suelen adoptar clases de precisión de 0,5 o 1,0 para garantizar la fiabilidad. También requieren una gran adaptabilidad de la temperatura para ofrecer mediciones precisas en condiciones extremas, algo esencial para la conducción de largas distancias y climas hostiles.
Con sensores MEMS de alta precisión y procesamiento de señales avanzado, los medidores digitales modernos pueden lograr una precisión de medición de hasta ±0,05%, lo que mejora enormemente la confiabilidad y precisión. Este monitoreo de alta precisión permite a los vehículos mantener una presión óptima de los neumáticos, mejorando el manejo y extendiendo la vida útil de los neumáticos.
Técnicas de procesamiento de señales analógicas a digitales
2.1 Características de las señales de salida del sensor
Los sensores de presión MEMS, como el WF162F, emiten señales analógicas a nivel de milivoltios, normalmente de 70 a 150 mV a escala completa. Estas señales débiles son susceptibles a interferencias electromagnéticas y fluctuaciones de temperatura, y no pueden usarse directamente para visualización o procesamiento digital. Si bien las salidas analógicas ofrecen una respuesta rápida y alta resolución, requieren acondicionamiento de señal y conversión ADC para medidores digitales.
Características clave de salida:
Amplitud: Nivel de milivoltios (aprox. 70–150 mV de escala completa)
Compensación cero: –18 a 22 metros de desviación
Linealidad: Dentro de ± 0.3%fs
Sensibilidad a la temperatura: Cero y sensibilidad a la deriva con temperatura
Estos factores determinan la ruta de procesamiento de señales posterior para lograr salidas digitales precisas.
2.2 Acondicionamiento de señales y diseño de circuitos amplificadores
El acondicionamiento de señales transforma la salida bruta del sensor en señales estandarizadas. El proceso de acondicionamiento típico para WF162F incluye:
Amplificador de instrumentación de precisión: Amplifica la señal débil de milivoltios a 0–5 V o 0–3,3 V para entrada ADC, con ganancias de 20 a 40 × y garantiza bajo ruido, baja compensación y alto rechazo de modo común.
Circuito de calibración de compensación cero: Utiliza voltajes de referencia de precisión y amplificadores operacionales para anular la compensación cero de –18 a 22 mV, a menudo implementado con potenciómetros digitales controlados por microcontrolador para calibración automática.
Filtración: Los filtros activos RC de paso bajo y de múltiples etapas (corte de 50 a 100 Hz) eliminan el ruido de alta frecuencia y al mismo tiempo preservan el contenido de la señal de presión.
2.3 Conversión de ADC e implementación de salida digital
Los manómetros digitales utilizan ADC de 16 a 24 bits para capturar variaciones finas de presión. Un ADC de alta resolución que convierte señales de 0 a 5 V en valores discretos de 65 536 (16 bits) a 16 777 216 (24 bits) ofrece una alta fidelidad de medición.
El procesamiento digital incluye:
Sobremuestreo & Promediando: Reduce el ruido aleatorio promediando múltiples muestras
Filtrado Digital: Los filtros FIR o IIR mejoran aún más la calidad de la señal
Corrección de no linealidad: Tablas de búsqueda o ajustes polinomiales compensados ± 0.3%FS no linealidad
Compensación de temperatura: Algoritmos utilizando datos de temperatura integrados
Los valores procesados se muestran en pantallas LCD/OLED o se transmiten a través de SPI, I2C o UART. Los medidores avanzados ofrecen registro de datos y transmisión Bluetooth para monitoreo remoto.
Esta cadena de analógico a digital convierte con precisión señales de milivoltios en lecturas de presión digitales de alta precisión, proporcionando información intuitiva y confiable.
 Analógico")
Compensación de temperatura y estabilidad de medición
3.1 Mecanismos de los efectos de la temperatura sobre la precisión
La temperatura afecta significativamente la precisión del sensor MEMS a través de la deriva cero (–30 a 20 µV/°C) y cambios de sensibilidad (–0,25 % a –0,15 % FS/°C). Sin compensación, las mediciones pueden tener errores de más del 10 % entre –40 °C y 125 °C, superando con creces los requisitos de control de neumáticos.
Los efectos específicos incluyen:
A bajas temperaturas, el aumento de los coeficientes del piezoresistor aumenta la sensibilidad.
A altas temperaturas, la deriva cero empeora y la linealidad se degrada
Los cambios rápidos de temperatura causan errores transitorios debido a la expansión térmica diferencial
La temperatura de los neumáticos puede superar los 80°C en condiciones de alta velocidad, lo que hace esencial una compensación efectiva.
3.2 Métodos de compensación de temperatura del hardware
Las estrategias de compensación basadas en hardware incluyen:
Resistencias de autocompensación: Selección de materiales de resistencia con coeficientes de temperatura personalizados durante la fabricación para la compensación inicial (efectivo entre 0 y 70 °C).
Diseño de puente con equilibrio térmico: Agregar resistencias en serie/paralelo para crear un puente con equilibrio de temperatura inherente de –25 °C a 85 °C.
Sensor de temperatura integrado: Los elementos sensores de temperatura en chip proporcionan datos en tiempo real para una compensación precisa.
3.3 Estrategias de compensación algorítmica digital
Los enfoques digitales mantienen una alta precisión en rangos comerciales (–10 °C a 60 °C), industriales (–25 °C a 85 °C) y militares (–40 °C a 125 °C):
Ajuste polinomial: Calibración de múltiples puntos de temperatura y ajuste de ecuaciones de segundo a cuarto orden para compensación de sensibilidad y cero.
Compensación lineal segmentada: Dividir el rango en intervalos, cada uno con corrección lineal (simple pero requiere más datos).
Modelos de aprendizaje automático: Redes neuronales que mapean la temperatura, la producción bruta y la presión real para efectos no lineales y de acoplamiento; Ofrece alta precisión pero exige amplios datos de entrenamiento.
La combinación de hardware y métodos digitales logra ±0,5%FS en rangos comerciales, ±1%FS en industriales y ±1,5%FS en rangos militares.
3.4 Funciones de compensación dinámica de temperatura
Para temperaturas que cambian rápidamente, durante altas velocidades o frenado de emergencia, los medidores avanzados toman muestras de la temperatura entre 1 y 10 Hz y aplican filtrado adaptativo para corregir errores transitorios. La detección de temperatura multipunto (por ejemplo, la temperatura del gas de los neumáticos y de la carcasa) captura gradientes térmicos y refina las estimaciones.
Estas técnicas garantizan un rendimiento estable incluso bajo dinámicas térmicas adversas.
Ventajas de rendimiento y adaptabilidad
4.1 Análisis de precisión y estabilidad
Los sensores MEMS analógicos como el WF162F ofrecen una no linealidad de ±0,3 %FS y, con acondicionamiento y compensación, logran una precisión del sistema de ±0,5 %FS. En un rango de 11 bar, esto equivale a un error absoluto máximo de 0,055 bar (5,5 kPa), lo que satisface los requisitos de medición precisos.
La deriva a largo plazo es típicamente <00,1% FS/año, gracias a la estabilidad mecánica y la fabricación refinada del silicio, lo que garantiza un rendimiento constante durante 5 a 10 años sin recalibración frecuente.
Los tiempos de respuesta están en el rango de milisegundos, lo que captura cambios rápidos de presión críticos para el monitoreo en tiempo real.
4.2 Durabilidad y resiliencia ambiental
El WF162F soporta 2x sobrecarga (22bar) y 4x presión de estallido (44bar) sin sufrir daños. Funciona de –40 °C a 125 °C, con un sellado robusto contra el polvo, la humedad y las vibraciones. Las versiones de grado militar se extienden de –55 °C a 150 °C.
La vida útil típica supera el millón de ciclos de presión, superando con creces los ciclos de los neumáticos y reduciendo los costos de mantenimiento.
4.3 Requisitos de energía y características energéticas
A 5 V, la corriente de funcionamiento es de 1 a 2 mA (5 a 10 mW). Acepta suministros de 4,5 a 10 V, compatibles con sistemas de 3,3 V y 5 V.
El bajo consumo de energía permite medidores portátiles con una duración de batería de 500 a 1000 h y sistemas TPMS que duran varios años. Los modos incluyen muestreo normal, de bajo consumo y suspensión profunda, lo que optimiza el uso de la batería.
4.4 Rentabilidad y escalabilidad
Los sensores analógicos cuestan menos que las salidas digitales de precisión comparable. La fabricación madura y los altos rendimientos hacen bajar los precios en aplicaciones de gran volumen. Las interfaces estandarizadas permiten la compatibilidad con múltiples proveedores, lo que reduce el riesgo de suministro.
Los diseños de referencia y los módulos de acondicionamiento de señales aceleran los ciclos de desarrollo, lo que permite un rápido tiempo de comercialización. Las soluciones analógicas igualan o superan el rendimiento digital a una fracción del costo, lo que las hace ideales para la implementación masiva.
Herramientas de medición y métodos de verificación de precisión
5.1 Equipos de prueba y calibración
Los calibradores de presión de alta precisión (medidores de pistón o controladores digitales) con una precisión de 0,01 % a 0,05 % FS proporcionan presiones de referencia para la verificación del sensor. Las cámaras de temperatura programables (de –70 °C a 180 °C, estabilidad de ±0,5 °C) prueban el rendimiento de la temperatura. Los sistemas de adquisición de datos con ADC de 24 bits y amplificación de bajo ruido capturan señales a nivel de microvoltios.
cación USB (1)")
5.2 Técnicas de medición de parámetros del sensor
Los parámetros clave se miden de la siguiente manera:
Resultados cero y de escala completa: Registre las salidas a 0 y presiones de escala completa para determinar la sensibilidad y la compensación.
No linealidad: Recopile datos en 5 a 11 puntos espaciados uniformemente y calcule la desviación máxima de la respuesta lineal ideal.
Coeficientes de temperatura: Realice barridos de temperatura en incrementos de 10 °C, estableciendo curvas de temperatura versus compensación y sensibilidad.
Histéresis: Comparar secuencias de presión ascendente y descendente.
Repetibilidad: Aplique condiciones idénticas varias veces y analice la coherencia de la salida.
Durabilidad: Someta los sensores a ciclos de presión de 100k a 1M y ciclos de temperatura de 1k a 10k.
5.3 Garantizar la precisión del medidor
La precisión depende de hacer coincidir el rango de sensores con la aplicación, optimizar el diseño de la cadena de señal y emplear componentes de alta calidad. La calibración de fábrica en puntos de presión y temperatura genera parámetros de corrección almacenados en cada dispositivo. Las funciones de calibración del usuario permiten ajustes periódicos a cero para contrarrestar la deriva, manteniendo la precisión del sistema en ±0,5% FS.
5.4 Verificación de la precisión in situ
Las pruebas de campo comparan dispositivos con medidores de referencia de grado superior (clase de precisión de 0,1 o 0,25) en mediciones paralelas. Las pruebas de coherencia por lotes utilizan varias unidades en la misma fuente. Las pruebas de durabilidad en el mundo real implican entre 3 y 6 meses de pruebas en carretera en diversas condiciones. La acreditación de terceros por parte de institutos de metrología proporciona una validación autorizada. Se recomienda una recalibración de rutina cada 6 a 12 meses para uso profesional y de flotas.
Conclusión
La integración de sensores de presión analógicos en manómetros digitales de neumáticos ejemplifica la sinergia entre la microelectrónica y la ingeniería mecánica. Los sensores absolutos MEMS como el WF162F, con un rango de 0 a 11 bar y una precisión de ±0,3% FS, brindan mediciones confiables de –40 °C a 125 °C mediante acondicionamiento de señal avanzado y compensación de temperatura.
La madura cadena de procesamiento analógico a digital, que incluye amplificación, filtrado, conversión ADC y posprocesamiento digital, traduce con precisión señales de milivoltios en lecturas digitales precisas. Los métodos combinados de compensación de hardware y software garantizan una alta precisión en rangos de temperatura comerciales, industriales y militares.
Los sensores analógicos ofrecen precisión, estabilidad, respuesta dinámica, durabilidad, resiliencia ambiental y eficiencia energética superiores. Su rentabilidad y escalabilidad los convierten en la opción preferida para aplicaciones de monitoreo de presión de neumáticos a gran escala.
Los protocolos integrales de calibración y verificación garantizan una precisión en todo el sistema de ±0,5 % FS, lo que proporciona a los usuarios finales datos de presión confiables. A medida que aumentan los estándares de seguridad automotriz y crece la conciencia de los consumidores, los medidores digitales basados en sensores analógicos de alta precisión desempeñarán un papel cada vez más vital en las aplicaciones OEM y del mercado de repuestos, apuntalando la seguridad en la conducción y el ahorro de combustible.
La introducción anterior sólo toca la superficie de las aplicaciones de la tecnología de sensores de presión. Continuaremos explorando los diferentes tipos de elementos sensores utilizados en diversos productos, cómo funcionan y sus ventajas y desventajas. Si desea obtener más detalles sobre lo que se analiza aquí, puede consultar el contenido relacionado más adelante en esta guía. Si tiene poco tiempo, también puede hacer clic aquí para descargar los detalles de estas guías. Producto del sensor de presión de aire datos PDF.
Para obtener más información sobre otras tecnologías de sensores, por favor Visite nuestra página de sensores.
![¿Por qué es necesario tarar la bomba de aire? | [Solución de bomba de aire PCBA]](https://wfsensors.com/wp-content/uploads/2024/06/WF183DE-1100kPa-Digital-Model-Absolute-Pressure-Sensor-1.jpg.webp)