Katalog
Smartwatch blood pressure monitoring relies on precise coordination between a micro pump and a high-resolution pressure sensor. Centered on the WF3050D digital MEMS sensor, this article delivers an end-to-end solution: from requirements analysis, sensor selection, system integration, to installation/soldering best practices and pre-production testing tools. The approach balances ultra-compact size, low power, and high accuracy, enabling rapid feasibility assessment and deployment.
For reference only
Application Background and Requirements Analysis
A smartwatch blood pressure feature must control pressure changes within a tiny space. The micro pump should fit under 1cm³ and generate 0–50kPa; the sensor requires ±1%FS accuracy, digital output, and low drift (≤0.5%FS/°C), with standby current <10µA and active <1mA. Motion and temperature variation on the wrist pose stability challenges, demanding ≥200Hz sampling for clear pulse waveform capture. Engineers must balance layout, power design, and algorithm integration, while procurement managers focus on supply consistency and production yield.
1.1 Space and Power Constraints
Ultra-compact module combines pump, tubing, and sensor, with attention to heat dissipation and shock resilience.
Low overall power draw extends battery life, matching watch capacity.
1.2 Accuracy and Responsiveness
±1%FS meets medical monitoring standards.
≥200Hz sampling captures full pulse waveform without aliasing.
1.3 Interface Compatibility
WF3050D’s PDM/I²S digital interface reduces PCB complexity.
Fast bus integration with MCU simplifies firmware design.
Sensor Selection and Parameter Matching
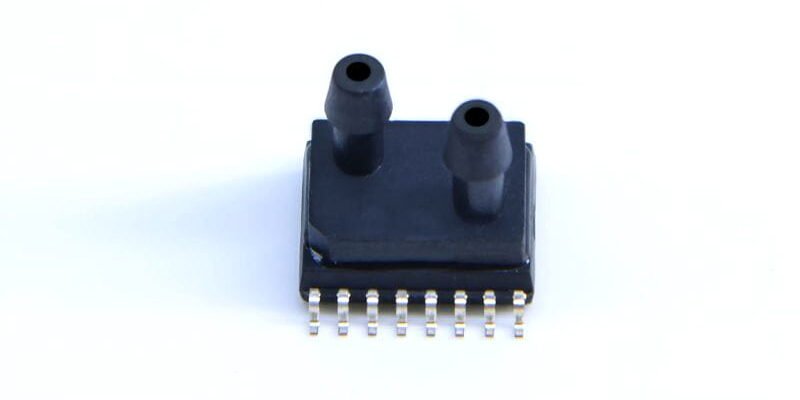
Among MEMS sensors, the WF3050D stands out: 3.0×5.0×0.93mm size, 0–50kPa range, digital I²S/PDM, and 0.48%FS/°C drift. Typical accuracy ≤±0.5%FS supports blood pressure tracking up to 200mmHg. Operating voltage 1.7–3.6V matches watch rails, and no external ADC is needed. Top-port design eases gas routing; metal lid adds impact resistance.
2.1 Range and Precision
0–50kPa covers 95–200mmHg clinical window.
Non-linearity ≤±0.3%FS and high repeatability.
2.2 Thermal Behavior
Drift ≤0.48%FS/°C, further improved with first-order compensation.
Responstid <2ms for rapid pressure changes.
2.3 Electrical Fit
Direct digital output to MCU reduces noise and power.
Low-voltage start-up enables quick wake-up.

System Integration and Micro Pump Design
Effective collaboration of sensor and pump hinges on gas routing, mechanical support, and EMC design.
Gas Routing: Short silicone tubing (≤5mm, Ø1.2mm) minimizes dead volume.
Mechanical Mounting: Aluminum bracket with dual-layer damping foam reduces vibration.
EMC Practices: Place filter caps and ground plane around digital lines to curb noise.
Firmware Calibration: Auto zero-point calibration at start-up with temperature drift compensation.
3.1 Gas Path Optimization
Chamber volume ≤10µL cuts residual air.
Low-adsorption tubing prevents gas retention.
3.2 Vibration Isolation & Thermal Control
Vibration damping pads lower mechanical noise.
Copper thermal pad under sensor fosters temperature uniformity.
3.3 Firmware Algorithms
Startup auto-calibration, continuous drift correction.
High-speed sampling with digital filters balances speed and stability.
Installation and Soldering Notes
Proper placement and soldering are critical for performance and yield.
Orientation: Align top port toward pump path to avoid blockage.
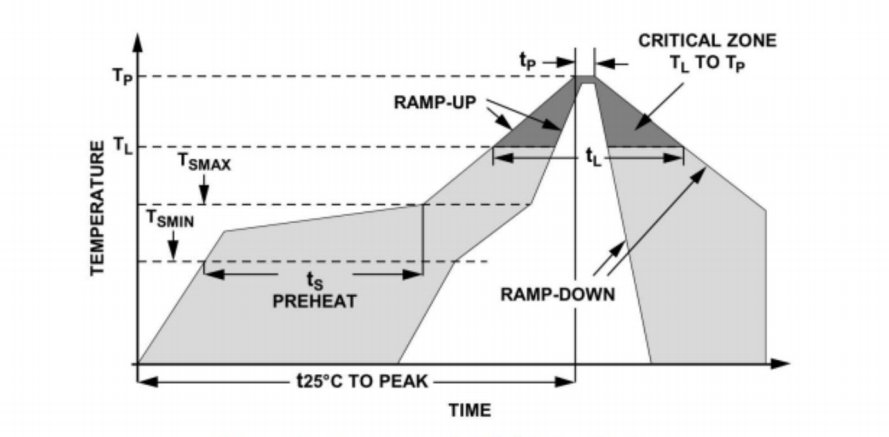
Reflow Profile: Peak ≤260°C with 10–20s in 230–260°C zone.
Solder Paste: SnAgCu3.0, 45–75µm particles for reliable joints.
PCB Pad Design: Large ground pad beneath sensor for shielding, ground plane perimeter.
Dust & Moisture Protection: Seal port promptly after placement to prevent contamination.
4.1 SMT Process Curve
Preheat: 120–150°C → Soak: 150–180°C → Reflow: 230–260°C → Cool, ≤4°C/s.
Paste thickness: 100–120µm.
4.2 Post-Reflow Inspection
AOI checks placement within 0.1mm tolerance.
X-ray confirms void-free solder joints.
Pre-Production Testing and Measurement Tools
Before mass production, set up multi-stage tests to ensure consistency:
Functional Check: Calibrated gas source at 0/20/40kPa, record error across points.
Environmental Stress: 85°C/85%RH for 48h to assess drift.
Vibrationer & Shock: 10–2000Hz @5g for 30min.
EMC Compliance: Radiated and conducted immunity per IEC61000-4.
Equipment:
Precision gas calibration bench (0.1Pa resolution).
High-speed DAQ (≥2kHz).
Automated test fixtures with board handling.
5.1 Calibration Workflow
Warm-up 5min → Apply standard pressures → Record output → Compute linearity & offset → Generate calibration curve.
5.2 Data Traceability
Sensor batch coding for full trace.
Automated data logging into MES enables quality analytics.
Konklusion
This guide details an end-to-end solution for integrating WF3050D digital MEMS pressure sensors into smartwatch micro-pump blood pressure systems. Covering requirements analysis, sensor selection, system integration, installation best practices, and pre-production testing, it ensures miniaturization, low power, precision, and reliability—empowering engineers teams to deploy high-performance smartwatch blood pressure features with confidence.
Ovenstående introduktion ridser kun overfladen af anvendelserne af tryksensorteknologi. Vi vil fortsætte med at udforske de forskellige typer sensorelementer, der bruges i forskellige produkter, hvordan de virker, og deres fordele og ulemper. Hvis du gerne vil have flere detaljer om, hvad der diskuteres her, kan du tjekke det relaterede indhold senere i denne vejledning. Hvis du er presset på tid, kan du også klikke her for at downloade detaljerne i denne guide Lufttrykssensor Produkt PDF -data.
For mere information om andre sensorteknologier, venligst Besøg vores Sensors -side.