كتالوج
Judging the linearity of a pressure sensor is a very important and common task, as it directly affects the measurement accuracy of the sensor.
1. What is Linearity?
Linearity, also called non-linearity error, refers to the maximum deviation between the actual output characteristic curve of a pressure sensor (the relationship between output signal and input pressure) and an ideal straight line (the fitted line). This deviation is usually expressed as a percentage of the full-scale output (FSO, Full Scale Output).
Put simply, an ideal pressure sensor’s output should be perfectly proportional to the input pressure, forming a straight line. In reality, however, due to manufacturing processes, material properties and other factors, every sensor’s actual curve shows slight fluctuations. Linearity is the metric that measures how “straight” that actual curve is.
")
2. Key steps to calculate linearity
1). Obtain calibration data
This is the basis for judging linearity. You need to record the sensor’s output at a series of known, evenly distributed pressure points (usually including the zero point and the full-scale point, plus at least 3–5 intermediate points). These data are often provided by the sensor manufacturer (in the product datasheet), or you can collect them yourself using high-precision calibration equipment.
2). Determine the “fitted line”
Calculating linearity requires a reference — the “fitted line”. How this line is drawn varies, and the chosen method directly affects the linearity figure. When interpreting linearity, the first task is to confirm which fitting method the datasheet or report used.
Common methods include:
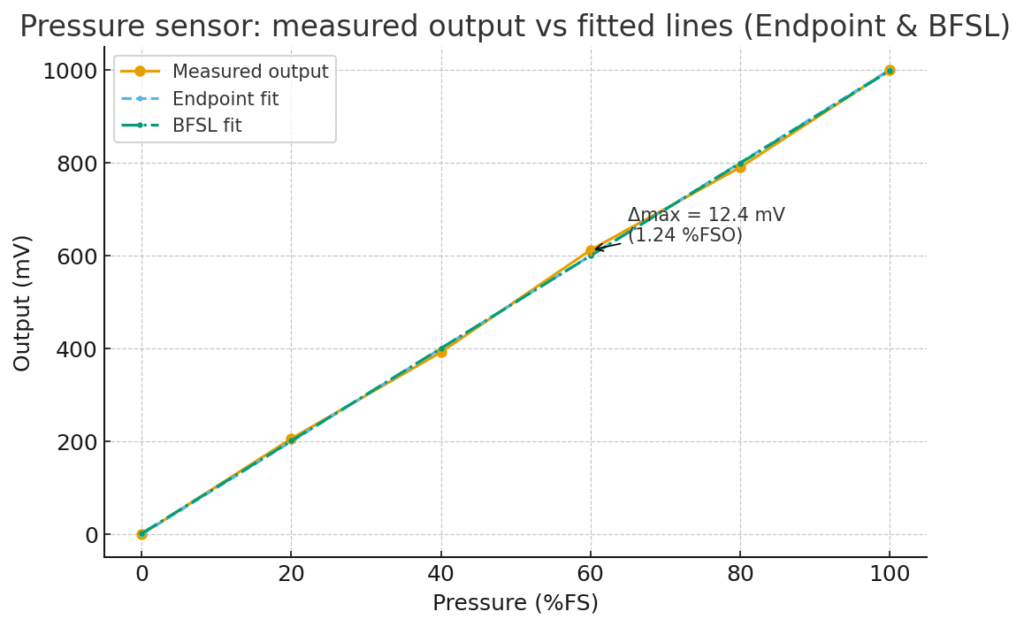
End Point Line: Draw a straight line between the zero point (0% pressure) and the full-scale point (100% pressure). This is the most common and simplest method.
Best Fit Straight Line (BFSL) or Least Squares Method: Use mathematics to find the line that minimises the sum of squared deviations between the line and all actual data points. This usually yields a smaller linearity error than the end point method.
Zero-Based Method: Force the fitted line through zero, then adjust its slope to minimise the maximum deviation.
Important note: Linearity figures obtained using different fitting methods are not directly comparable! For example, a sensor specified as ±1.0%FS linearity by the end point method could perform similarly to one specified as ±0.5%FS by the best-fit method. Therefore, you must be clear about the reference method.
3). Calculate the maximum deviation Determine the “fitted line”
Based on the chosen fitted line, compute at each calibration point the difference between the actual output and the theoretical value on the fitted line:
Deviation = Actual output − Fitted-line value
Find the largest absolute deviation among all points — that is the maximum deviation (Δmax).
4). Calculate the linearity error
Divide the maximum deviation by the sensor’s full-scale output (FSO) and express it as a percentage:
Linearity error (%) = (|Δmax| / FSO) × 100%
Where FSO = V_max − V_min.
3. How to interpret linearity figures in a datasheet?
Check the value: The smaller the figure, the better the linearity and the higher the sensor accuracy. For example, ±0.1%FS is far better than ±1.0%FS.
Check the unit: Make sure it’s %FS (percentage of full scale). That’s the standard unit. Sometimes you may see %Reading (percentage of reading), which is stricter at the low end — be careful to distinguish the two.
Check the conditions: Note the temperature and other conditions under which the linearity was specified (typically room temperature, 25°C). Temperature changes can significantly affect linearity.
Check the method (most important!): Always confirm which fitted-line method was used to calculate the linearity.
The linearity and slope performance are excellent
خاتمة
Linearity measures how closely a pressure sensor’s output follows an ideal straight line and is expressed as the maximum deviation relative to full-scale output (FSO). To assess it you collect calibration points, choose a fitted-line method (end point, BFSL, or zero-based), compute the maximum deviation Δmax, and convert it to a percentage of FSO. Always check the datasheet’s unit, temperature conditions and fitting method before comparing sensors.
المقدمة أعلاه لا تخدش سوى سطح تطبيقات تكنولوجيا استشعار الضغط. سنستمر في استكشاف الأنواع المختلفة لعناصر المستشعر المستخدمة في المنتجات المختلفة وكيفية عملها ومزاياها وعيوبها. إذا كنت تريد مزيدًا من التفاصيل حول ما تمت مناقشته هنا، فيمكنك الاطلاع على المحتوى ذي الصلة لاحقًا في هذا الدليل. إذا لم يكن لديك وقت كاف، يمكنك أيضًا النقر هنا لتنزيل تفاصيل هذه الأدلة منتجات استشعار ضغط الهواء PDF بيانات.
لمزيد من المعلومات حول تقنيات الاستشعار الأخرى، من فضلك قم بزيارة صفحة أجهزة الاستشعار لدينا.


